Outcome Program · Should-Cost & Supply-Chain Resilience
Claw back supplier markups and eliminate sub-tier chokepoints.
Build bottom-up parametric should-cost models from commodity indices, cycle times and tooling schedules—and map sub-tier foundries, chemical refiners and domestic alternates before re-tendering or reshoring.
The commercial challenge
Procurement teams negotiate blind against supplier quotes and hidden sub-tier dependencies.
Suppliers routinely embed paid-off mould and die amortization, uncredited metallic swarf scrap and expired energy or freight surcharges inside unit prices. At the same time, two direct Tier-1 suppliers often rely on the exact same upstream sub-tier forge or specialty material source.
- Expired tooling amortization and temporary inflation surcharges still billed in unit component prices.
- Single-point upstream dependencies in rare-earth magnets, elastomers, castings and energetics hidden behind Tier-1 suppliers.
- Factory lead times dominated by non-value-added station dwell rather than active machining or assembly.
What your team receives
Four decision-ready deliverables in one program.
We build bottom-up parametric cost models across machined, moulded, electronic, blended and assembled components to separate raw-material, energy and labour drivers from vendor markups and paid-off tooling amortization, while mapping upstream sub-tier dependencies.
- 01
Parametric component should-cost clean-sheets
Four-layer cost decomposition (raw material net of swarf credits, machine cycle physics, tooling amortization audit, normalized overhead and margin) with zero spec changes.
- 02
Multi-tier supply-chain dependency map
Sub-tier mapping from Prime and Tier-1 assembly down to Tier-2 subsystems and Tier-3 machine shops, raw materials and tariff exposure.
- 03
Dwell audit & cell-layout throughput plan
Process cycle efficiency decomposition isolating non-value-added waiting and sizing parallel cell conversion or site co-location.
- 04
Supplier negotiation fact packs
Component-by-component clawback scripts, index-escalation bands and qualified domestic alternate shortlists.
Illustrative output
How the executive brief and reconciled databook are structured.
Every cell in the accompanying spreadsheet model is formula-driven and tagged either empirically sourced (with document and page citation) or model-inferred (with stated benchmark assumptions).
| Component or cost layer | Current quote | Should-cost model | Clawback poolCA$M | Confidence |
|---|---|---|---|---|
| Machined alloy manifold · swarf credit & cycle | $420 | $340 | $6.4M | high |
| Injection housing · expired mould amortization | $85 | $68 | $5.1M | high |
| Stamped bracket · index surcharge reset | $32 | $26 | $4.8M | high |
| Wire harness & PCB · sub-tier dual-sourcing | $190 | $160 | $6.5M | medium |
Capabilities & starting scopes
Start with one deliverable or run the full outcome loop.
Each outcome program draws on specific steps of the research loop and can be commissioned as a focused starting deliverable or a recurring program.
Map
How does this market work, and where are the gaps?
Trace multi-tier supply chains from Prime and Tier-1 assembly down to Tier-2 subsystems and Tier-3 machine shops, raw-material refiners and qualified domestic alternates.
You getValue-chain map
Diagnose
Where is the value, or the risk?
Decompose unit component quotes into raw material net of scrap credits, machine cycle times, tooling amortization and overhead—and isolate station dwell across factory floors.
You getDiagnostic and peer benchmark
Plan
What should we do, and what is it worth?
Sequence immediate tooling and surcharge clawbacks alongside dual-sourcing qualifications and cell-layout throughput improvements.
You getValue creation plan
Monitor
What changed since the last review?
Re-index supplier price bands against live metal, resin and freight benchmarks each quarter to flag retained vendor surcharges before contract renewals.
You getQuarterly monitoring read
Starting research deliverables
How to start
One question, a fixed fee, a first read in days.
- Your question
- One live question, with the decision it serves.
- What comes back
- A reviewed answer with a point of view (a ranked shortlist, a diagnostic or a plan), with every source and anything unverified flagged.
- The fee
- The fee is fixed and agreed before work starts.
- The timing
- A first read in days, not weeks, then the reviewed brief on the date we agree.
We can provide regular research updates after the first project.
Industries & buyer teams
Target sectors and teams that commission this outcome.
Choose your industry to see sector-specific research questions and sample workbooks, or select your team to see how we scope the first engagement.
Industries served
- Industrials & manufacturing
Audit component should-costs with zero spec changes, release cash trapped in branch inventory and unbilled work, and capture higher-margin aftermarket repair revenue.
- Defence
Help governments, prime contractors, companies, funds and advisers win a larger share of the defence build-up.
- Energy & utilities
Rank facility capex by return, benchmark asset operating cost, and release cash trapped in spare parts and project working capital.
- Retail & consumer
Isolate negative-margin SKUs, unbundle trading-house and freight markups, release cash trapped in seasonal inventory, and model direct-to-consumer channel shifts.
Teams we work with
- Procurement and supply chain
Negotiate from bottom-up manufacturing physics, not supplier quotes.
- Strategy teams
Release trapped cash, claw back supplier markups and fund growth.
- Risk teams
Turn supply-chain, asset-cost and credit risk into cash-flow numbers.
- Governments and agencies
Know your region’s industries, and where to act first.
Anonymized proof
What our analysts have uncovered across delivered engagements.
$22M
Found $22M in component markups across 5 anchor SKU families (14–23% unit-cost cut) from paid-off tooling and uncredited scrap, with zero spec changes.
14–18% markups
Found 14–18% intermediary trading-house markups across two-thirds of fabric spend and over 20% negative-margin core SKUs at a multi-banner apparel retailer.
$10M+ spares
$10M+ cash release found in pooled depot maintenance spares alongside immediate turnaround contractor rate cuts.
From the 15Rock Review
Field notes & whitepapers on should-cost & supply-chain resilience.
Analyst-checked teardowns, benchmarks, and decision frameworks drawn from delivered engagements.

The Regional Defence Concierge: Why Cluster Pitchbooks Need Machine-Level Proof, Not Logo Slides
Even a 4.43x advanced-manufacturing cluster suffers a 58% defence pipeline gap when its directory mixes academic labs with commercial plants and lacks machine-level proof.

Why General-Purpose AI Fails on Defence Supply Chains: The 20% Coverage Trap
Off-the-shelf AI assistants capture less than 20% of private sub-tier defence supply chains—and half of that 20% is wrong. Deterministic engineering graphs bridge the gap.
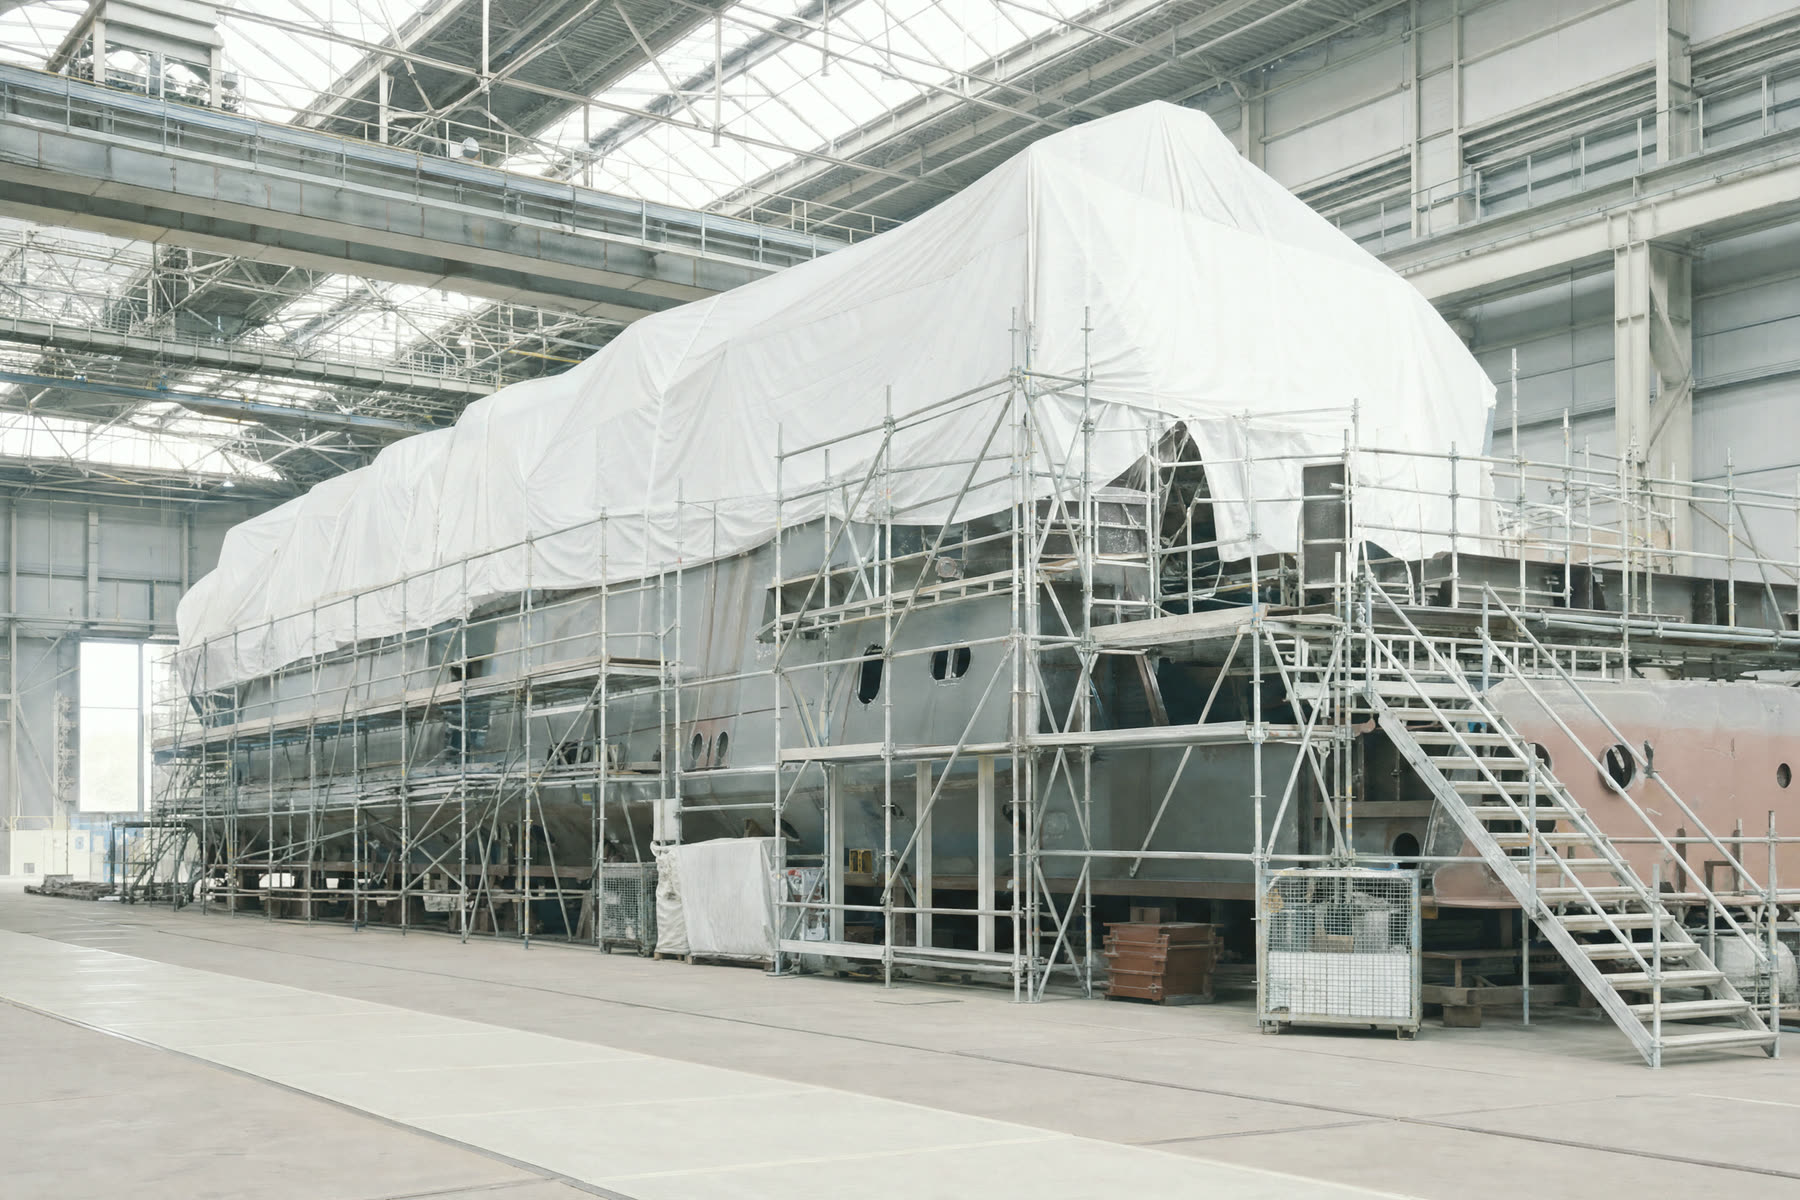
The 100% Offset Bottleneck: Breaking Tier-1 Saturation in Multi-Billion-Dollar Defence Tenders
When sovereign defence tenders mandate 100% domestic offsets, legacy Tier-1 primes saturate fast. Winning Value Proposition scores require Stage-4 sustainment and Tier-2…
Start with one question
Which component category, bill of materials or supply chain needs a clean-sheet audit?
Tell us what you’re investigating and when you need an answer. We’ll discuss the scope, inputs and research that would help.