Outcome Program · Opportunity Assessment & Tender Capture
Focus commercial capital and bid budgets where you can win and expand margins.
Rank markets, segments, channels and funded tenders by attractiveness and your ability to win.
The commercial challenge
Headline market budgets and top-line channel targets mislead when unit economics and credential gates are ignored.
Commercial expansion plans often overlook customer-acquisition drag, store-cohort payback and wholesale-versus-direct margin mix, while public procurement envelopes hide historical capital lapse rates and mandatory security or clinical registrations. Teams need a unified prioritization across commercial growth plays and funded tenders.
- Commercial growth plans built on headline category growth rather than store-cohort payback, channel margin mix and aftermarket attachment.
- Pursuit teams chasing headline prime contracts gated by unresolved controlled-goods, cyber or clinical credentials.
- Standard industry codes missing dual-use sub-tier manufacturers, clean-room assemblers and local offset partners.
What your team receives
Four decision-ready deliverables in one program.
We rank markets, segments, channels and funded defence or industrial tenders by structural attractiveness and ability to win—sizing market and channel entry bridges and assembling pre-screened domestic supplier benches.
- 01
Market and channel entry bridge
Unit-economic comparison across candidate markets, direct-to-consumer, boutique, adviser and wholesale channels, plus aftermarket maintenance and service bundling.
- 02
Structural Attractiveness vs. Ability-to-Win matrix
A scored two-by-two prioritization across candidate programs and market segments, separating demand durability and margin pool from technical fit and credential readiness.
- 03
Supplier & offset partner bench beyond industry codes
Capability-based ecosystem mapping across primes, sub-tier machine shops and regional innovation clusters, calibrated for geographic realism.
- 04
Credential gate & tender compliance business case
Requirement-by-requirement tender decomposition, phased credential registration and ten-year site co-location net present value modelling.
Illustrative output
How the executive brief and reconciled databook are structured.
Every cell in the accompanying spreadsheet model is formula-driven and tagged either empirically sourced (with document and page citation) or model-inferred (with stated benchmark assumptions).
| Candidate opportunity pool | Addressable poolCA$M | Capability fit | Entry gate | Confidence |
|---|---|---|---|---|
| Commercial aerospace aftermarket & MRO | $380M | High | Cleared | high |
| Clean-room satellite sub-assembly cells | $400M | High | Cleared | high |
| Foreign prime offset localization package | $400M | High | Cleared | high |
| Controlled-goods munitions & defence systems | $1,400M | High | Pending | medium |
Capabilities & starting scopes
Start with one deliverable or run the full outcome loop.
Each outcome program draws on specific steps of the research loop and can be commissioned as a focused starting deliverable or a recurring program.
- 01
Map
How does this market work, and where are the gaps?
Expose sub-tier supplier chokepoints, sourcing markups and domestic capability gaps.
You getValue-chain map
- 02
Find
Which ones should we go after first?
Originate off-market roll-up targets, win-ready defence programs and qualified borrowers.
You getScorecard and shortlist
- 03
Diagnose
Where is the value, or the risk?
Quantify trapped working capital, SKU and supplier markups, SG&A bloat and asset-level cost exposure.
You getDiagnostic and peer benchmark
- 04
Plan
What should we do, and what is it worth?
Build quantified EBITDA, cash-release, channel-mix and capex-phasing roadmaps.
You getValue creation plan
- 05
Monitor
What changed since the last review?
Re-index supplier should-costs, track peer watchlists and flag portfolio covenant shifts.
You getQuarterly monitoring read
Starting research deliverables
Value-chain map
Expose sub-tier supplier chokepoints, assemble domestic supplier benches beyond industry codes for defence and industrial tenders, and see where value pools sit.
Scorecard and shortlist
Originate off-market roll-up targets, match plant capabilities to funded defence and industrial tenders, or qualify mid-market borrowers.
Value creation plan
Size and sequence the initiatives that move EBITDA, cash conversion and valuation multiples: channel shifts, aftermarket capture, pricing and capex phasing.
How to start
One question, a fixed fee, a first read in days.
- Your question
- One live question, with the decision it serves.
- What comes back
- A reviewed answer with a point of view (a ranked shortlist, a diagnostic or a plan), with every source and anything unverified flagged.
- The fee
- The fee is fixed and agreed before work starts.
- The timing
- A first read in days, not weeks, then the reviewed brief on the date we agree.
We can provide regular research updates after the first project.
Industries & buyer teams
Target sectors and teams that commission this outcome.
Choose your industry to see sector-specific research questions and sample workbooks, or select your team to see how we scope the first engagement.
Industries served
- Defence
Help governments, prime contractors, companies, funds and advisers win a larger share of the defence build-up.
- Retail & consumer
Isolate negative-margin SKUs, unbundle trading-house and freight markups, release cash trapped in seasonal inventory, and model direct-to-consumer channel shifts.
- Industrials & manufacturing
Audit component should-costs with zero spec changes, release cash trapped in branch inventory and unbilled work, and capture higher-margin aftermarket repair revenue.
- Public sector
Benchmark municipal and agency service levels, reserve adequacy and capital plans against peers, and map regional supplier capability for industrial and defence programs.
- Healthcare & life sciences
Benchmark acute-care cost per weighted case, consolidate clinical and surgical SKU spend, and map domestic biomanufacturing and sterile-fill capacity.
Teams we work with
- Strategy teams
Release trapped cash, claw back supplier markups and fund growth.
- Governments and agencies
Know your region’s industries, and where to act first.
- Advisory firms
Walk into the pitch with the financial gap already sized.
- Procurement and supply chain
Negotiate from bottom-up manufacturing physics, not supplier quotes.
Anonymized proof
What our analysts have uncovered across delivered engagements.
34 companies assessed
34 companies assessed against defence procurement and industrial-participation opportunities.
Within a day
Screened the list and placed every firm on one chart of opportunity against readiness, with the case for each, within a day.
Site-by-site
Outside-in working-capital, component should-cost and site-by-site financial models for industrial, retail and energy assets — built without internal company data.
From the 15Rock Review
Field notes & whitepapers on opportunity assessment & tender capture.
Analyst-checked teardowns, benchmarks, and decision frameworks drawn from delivered engagements.

The Regional Defence Concierge: Why Cluster Pitchbooks Need Machine-Level Proof, Not Logo Slides
Even a 4.43x advanced-manufacturing cluster suffers a 58% defence pipeline gap when its directory mixes academic labs with commercial plants and lacks machine-level proof.

The Dual-Use Conversion Playbook: How Commercial Manufacturers Cross the Defence Credential Chasm
Commercial manufacturers that bid directly on classified defence tenders stall in the credential chasm. Sequencing Stage-1 dual-use space and offset cells wins work in 90 days.
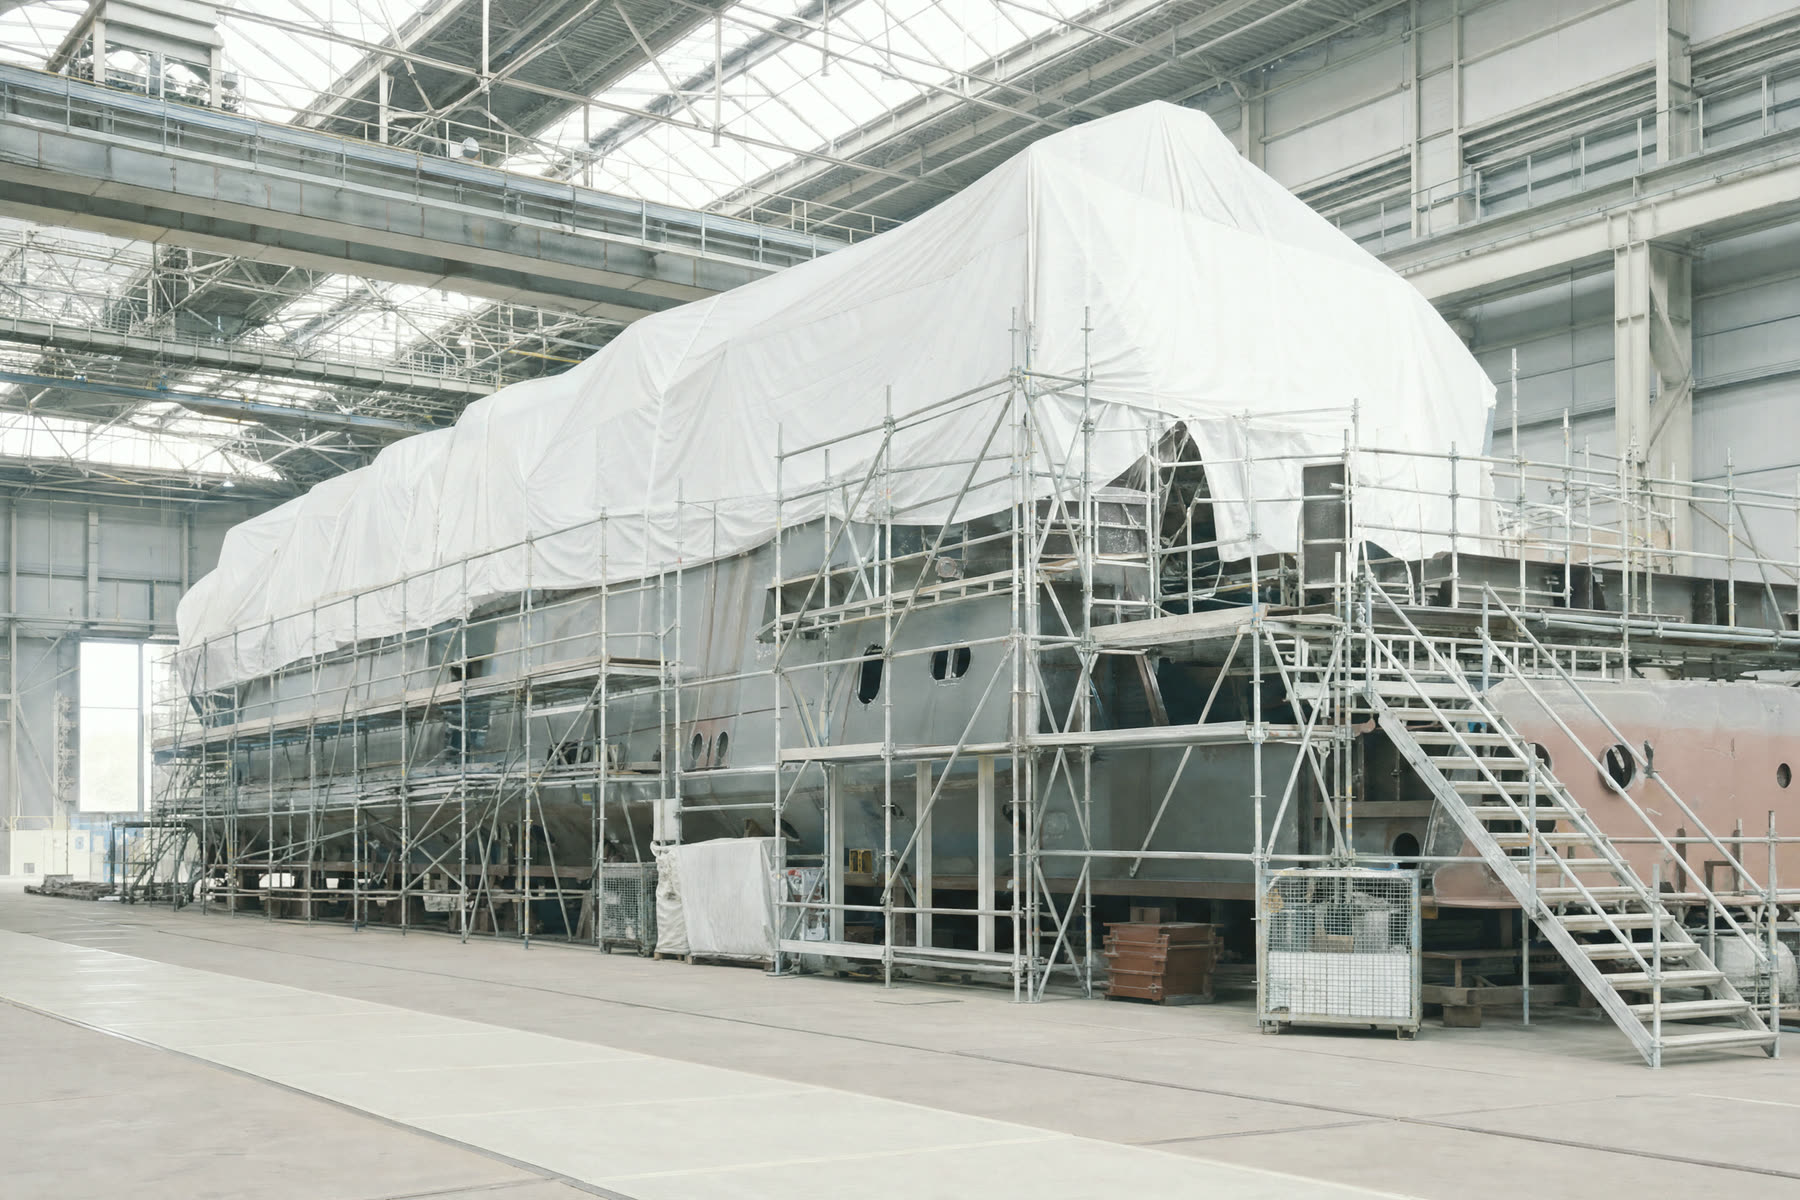
The 100% Offset Bottleneck: Breaking Tier-1 Saturation in Multi-Billion-Dollar Defence Tenders
When sovereign defence tenders mandate 100% domestic offsets, legacy Tier-1 primes saturate fast. Winning Value Proposition scores require Stage-4 sustainment and Tier-2…
Start with one question
Which commercial growth play, tender pipeline or regional cluster strategy needs a scored prioritization?
Tell us what you’re investigating and when you need an answer. We’ll discuss the scope, inputs and research that would help.