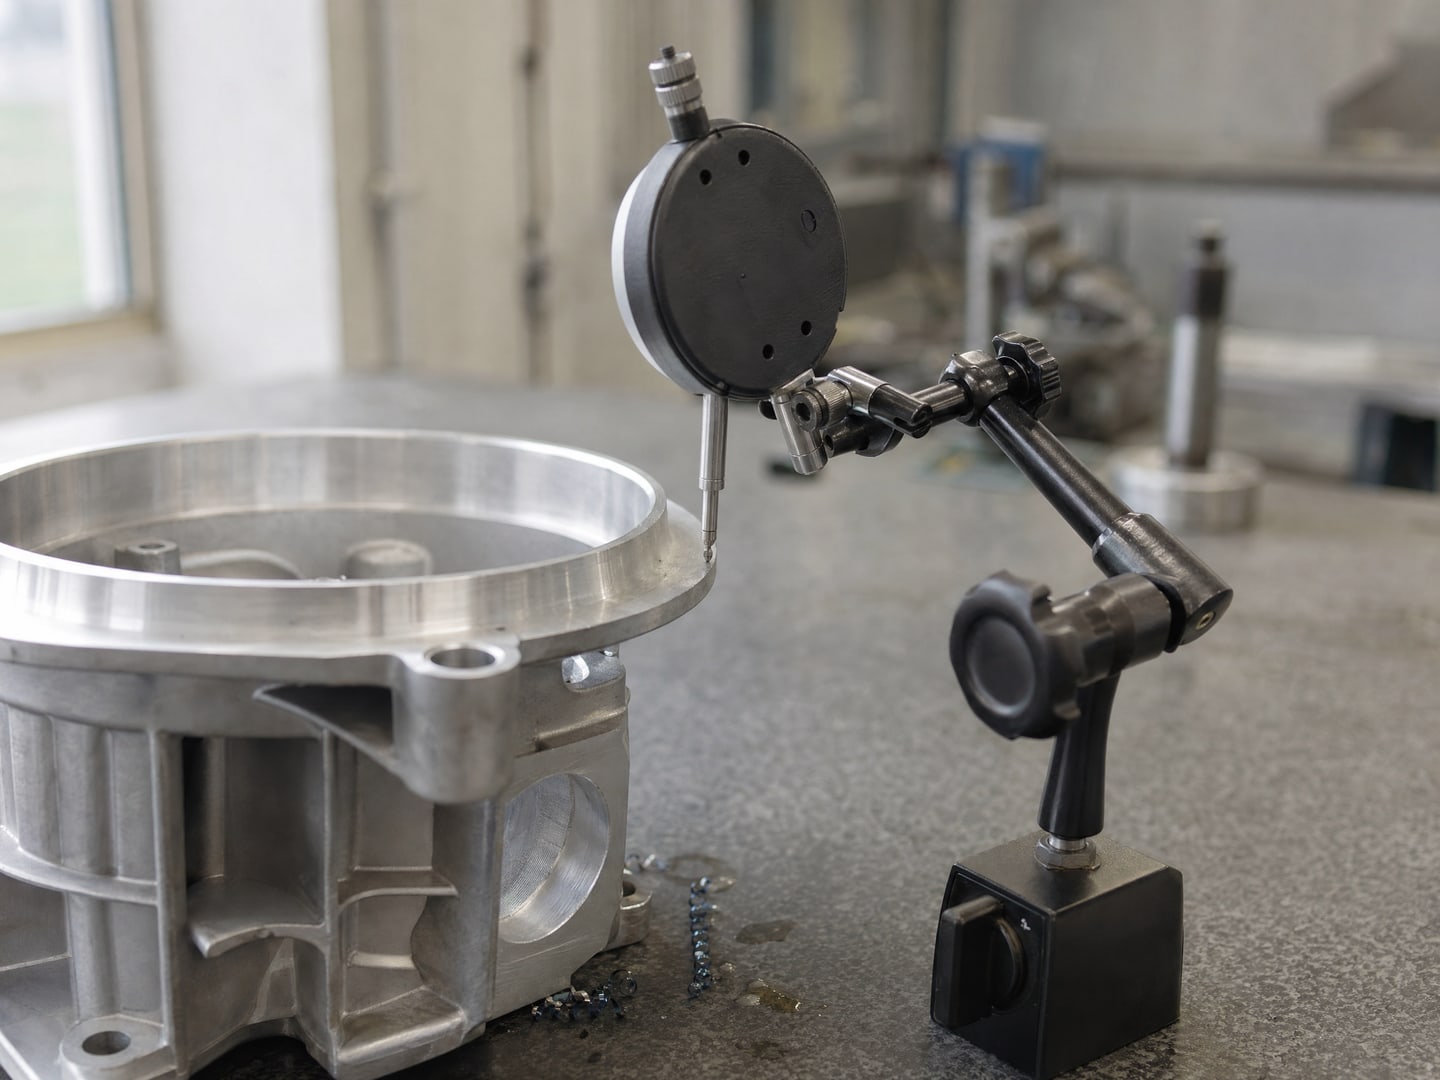
Your procurement team runs a three-bid RFP for a precision machined assembly and celebrates knocking 4% off the incumbent’s quote. They still overpaid by 24%. Comparing three opaque quotes inside a capacity-constrained oligopoly only measures how uniformly suppliers pad their margins. Across 42 teardowns in 15Rock’s library, our 4-Layer Physics Should-Cost Model—auditing alloy weight, spindle cycle times, wages, and overhead—uncovered 15% to 42% in recoverable price variance (28.4% weighted average).
The finding: competitive 3-bid RFPs leave 15%–42% of engineering should-cost variance on the table
Conventional procurement assumes that soliciting three to five bids from incumbent Tier-1 suppliers discovers the efficient engineering cost. But in specialized industrial, aerospace, defence, energy, and packaging markets, competing bidders pass through identical Tier-2 bottlenecks, hide uncredited scrap turnings, and amortize paid-off tooling forever. Therefore, three-bid RFPs systematically lock in oligopoly rent across three structural distortions:
- Shared Sub-Tier Bottlenecks: Three competing Tier-1 integrators frequently source forgings, castings, specialty resins, or electronics from the exact same Tier-2 mill or foundry—and simply layer differing SG&A and margin structures on top of an unchallenged base cost.
- Evergreen Amortization of Paid-Off Tooling and NRE: Once non-recurring engineering (NRE), custom dies, or qualification fixtures are fully amortized across the initial production lot, suppliers rarely remove the amortization adder from subsequent unit renewals unless confronted with a cycle-time clean sheet.
- Unindexed Commodity Pass-Through Ratchets: Suppliers rapidly pass through upward spikes in steel, aluminum, titanium, copper, or polymer resin indices via surcharge letters, but hold unit prices flat when underlying LME, CRU, or Platts feedstock indices revert by 20%–35%.
Across our 42-study procurement corpus, we compared the savings achieved by traditional “three-bid-and-a-buy” commercial negotiation (3%–6% off initial quote) against full bottom-up engineering clean-sheeting (15%–42% variance to quoted price).
| SKU / Component Family (n = 5 Flagship Industrial Teardown) | Annual Baseline Spend (US$M) | Quoted Unit Price (US$) | Layer 1: Raw Material & Scrap (US$) | Layer 2: Machine Cycle & Direct Labour (US$) | Layer 3: Factory Overhead & Tooling (US$) | Layer 4: Normative Margin (12%–15%) | Clean-Sheet Should-Cost (US$) | Overpayment Spread (% / US$M) | Epistemic Status |
|---|---|---|---|---|---|---|---|---|---|
| SKU-A: Precision 5-Axis Machined Housing | $24.50M | $1,420.00 | $385.00 | $290.00 | $165.00 | $126.00 | $966.00 | 32.0% ($7.84M) | [Calculated] |
| SKU-B: High-Pressure Welded Valve Assembly | $19.20M | $3,840.00 | $1,120.00 | $780.00 | $430.00 | $349.50 | $2,679.50 | 30.2% ($5.80M) | [Calculated] |
| SKU-C: Custom Extruded Aluminum Thermal Profile | $15.80M | $215.00 | $88.50 | $34.00 | $22.50 | $17.40 | $162.40 | 24.5% ($3.87M) | [Calculated] |
| SKU-D: Ruggedized Multi-Layer Wire Harness | $11.40M | $680.00 | $210.00 | $195.00 | $72.00 | $62.00 | $539.00 | 20.7% ($2.36M) | [Calculated] |
| SKU-E: Specialty Investment-Cast Impeller | $9.45M | $1,890.00 | $490.00 | $410.00 | $235.00 | $164.60 | $1,299.60 | 31.2% ($2.95M) | [Calculated] |
| Portfolio Total / Weighted Average (5 SKUs) | $80.35M | — | 36.9% of quote | 26.8% of quote | 14.5% of quote | 11.3% of quote | $57.53M eq. | 28.4% ($22.82M) | [Calculated] |
The framework: the 4-Layer Engineering Clean-Sheet Equation
A true should-cost model does not ask what a supplier wants to charge; it calculates what a component must cost to manufacture on a specific class of equipment in a specific geography, plus a fair return on invested capital. 15Rock decomposes every purchased part or sub-assembly into four deterministic layers:
The 4-Layer Bottom-Up Engineering Should-Cost Identity:
P_should-cost = [ W_gross × P_index × (1 + f_freight) − W_scrap × P_salvage ] + Σ{k=1..K} [ (t_cycle,k ÷ ηOEE,k) + (t_setup,k ÷ N_lot) ] × ( R_machine,k + n_op,k × R_labour ) + C_SG&A_OH + m_norm × ( C_mat + C_conv + C_OH )
Where:
- Layer 1 (C_mat): W_gross = Gross input weight from CAD geometry / nesting layout; W_scrap = W_gross − W_net credited at regional scrap salvage value P_salvage.
- Layer 2 (C_conv): t_cycle,k = Physics-based machine cycle time at routing step k (e.g., spindle metal-removal rate MRR = d × w × f_m); ηOEE,k = normative Overall Equipment Effectiveness (0.75–0.85); t_setup,k ÷ N_lot = setup and changeover time amortized over order lot N_lot.
- Layer 3 & 4 (C_OH & m_norm): R_machine,k = hourly machine burden rate (depreciation + power + tooling + floor space); R_labour = fully burdened regional operator wage (StatCan / BLS tables); m_norm = normative return on capital.
How the Four Layers Expose Hidden Supplier Padding
- Layer 1 (Net Raw Material & Scrap Recovery): Suppliers routinely bill buyers for the gross bar-stock or billet weight (W_gross) while retaining 100% of the turnings and off-cut salvage revenue (W_scrap × P_salvage). On aerospace aluminum, titanium, and copper-nickel alloys where buy-to-fly ratios reach 4:1 to 8:1, uncredited scrap recovery alone hides 6% to 11% of total part price [Calculated].
- Layer 2 (Routing Cycle Time & Lot-Size Amortization): When a buyer’s order volume scales from prototype lots (N = 25) to production runs (N = 500), the per-unit setup cost (t_setup / N_lot) drops by 95%. Without an explicit routing model, suppliers continue charging prototype setup absorption on production volumes.
- Layer 3 (Facility Overhead & Certification Burden): Distinguishes legitimate regulatory compliance costs (e.g., NADCAP heat-treat pyrometry, ASME Section III nuclear QA, or MIL-STD-810 environmental testing) from generic corporate overhead padding.
- Layer 4 (Normative Return on Capital): Benchmarks supplier operating margin against capital intensity (10%–12% for build-to-print stamping/fabrication; 14%–18% for IP-protected or nuclear/aerospace safety-critical assemblies).
The evidence: cross-sector should-cost teardowns across manufacturing, naval sustainment, and infrastructure
Our clean-sheet methodology has been validated across heavy industrial manufacturing, naval in-service support (ISS), energy infrastructure, and healthcare procurement (n = 42 engagements):
| Sector & Engagement Scope | Baseline Spend Audited | Primary Cost Distortion Uncovered | Verified Should-Cost Savings | Execution Mechanism | Epistemic Status |
|---|---|---|---|---|---|
| 1. Multi-Site Industrial OEM (5 Core SKU Families) | US$80.35M / yr | Uncredited alloy turnings scrap (+7.4%), unamortized prototype setups (+9.1%), and lagged LME/CRU steel/aluminum index pass-through (+11.9%) | US$22.82M / yr (28.4%) | Fact-based open-book renegotiation with incumbents + 2 Tier-2 dual-source awards | [Calculated] |
| 2. Sovereign Naval & Icebreaker Sustainment (18 Sub-Tier Systems) | C$420M lifecycle MRO | Tier-1 prime layered 22%–35% pass-through handling markups on OEM valve, pump, and HVAC spares sourced from commercial-equivalent plants | 18%–31% (C$75M–C$130M) | Direct OEM / Tier-2 framework agreements bypassing integrator pass-through fees | [Calculated] |
| 3. Heavy Steel Fabrication & Structural Assemblies | C$145M material & sub-fab spend | Mill-direct vs. service-center tiering spread (+14%) paired with unoptimized plate nesting scrap (18% actual vs. 9% normative) | C$16.2M / yr (11.2% of total COGS) | Mill-direct index collar + CAD nesting consolidation across 3 fabrication bays | [Observed] |
| 4. Regional Hospital Network Clinical & Facilities Procurement (66 Sites) | C$180M addressable non-labour spend | Fragmented site-level purchasing across 66 facilities paying list price for identical consumables and MRO service contracts | 14.5%–21.0% (C$26M–C$38M) | SKU crosswalk standardization + consolidated volume-tier rebidding | [Calculated] |
| 5. Autonomous UAV & Robotics Bill-of-Materials (500-Unit Lot vs. C$50,400 Blended ASP) | C$14.2M prototype BoM (C$28,400 / unit at N=25 lot) | Low-volume distributor pricing on propulsion, optics, and carbon-fibre structures prior to lot-size setup amortization (C$19,800 / unit at N=500, supporting 60.7% GM on C$50,400 ASP) | 30.3% unit BoM reduction (-C$8,600 / unit) | Clean-sheet lot-curve scaling from N=25 prototype to N=500 production tooling | [Modeled] |
The economics: why 1% of procurement clean-sheeting beats 4.5% of top-line sales growth
For a middle-market industrial portfolio company or operating division generating US$200M in revenue at a 12.0% EBITDA margin (US$24.0M EBITDA) where direct materials and subcontracted components represent 55.0% of revenue (US$110.0M addressable purchased COGS), a 1.0% clean-sheet cost reduction generates +US$1.10M of dollar-for-dollar EBITDA—whereas 4.0% top-line sales growth (+US$8.0M revenue at 12.0% margin) yields only +US$0.96M of EBITDA and requires 4.58% top-line sales growth (+US$9.17M new sales) just to match a single percentage point of procurement clean-sheeting:
Revenue vs. Should-Cost Leverage Comparison (US$200M Revenue Industrial Operator, US$110M Direct Purchased COGS, 12.0% Base EBITDA = US$24.0M):
- 1.0% Clean-Sheet Cost Reduction on US$110M Direct Spend = +US$1.10M EBITDA (+4.58% EBITDA lift; beats +4.0% sales growth of +US$0.96M)
- Path A (Commercial Sales Push): +20% revenue growth (+US$40.0M sales @ 12% margin) = +US$4.80M EBITDA (Requires CapEx, working capital & 18–24 months)
- Path B (15Rock Clean-Sheet on US$80.35M Core SKU Subset): -15.0% reduction = +US$12.05M EBITDA (+50.2% EBITDA lift; equals +US$100.4M of new sales)
The trap: benchmarking opaque quotes against each other instead of physical parameters
The tell: If your procurement team measures success by “3-bid RFP compliance” and negotiated percentage discounts off initial supplier quotes—without knowing the finished net weight (W_net), the gross input billet weight (W_gross), or the machine spindle cycle time (t_cycle) of the part—you are negotiating inside the supplier’s margin buffer rather than against engineering cost.
The decision agenda: transitioning from quote-shopping to open-book engineering negotiation
Chief Procurement Officers, private-equity operating partners, and plant general managers should replace adversarial price haggling with a three-step engineering protocol:
- Triage the Top 20% of SKUs by “Price-to-Weight” and “Single-Source Tenure” Outliers: Run a rapid Pareto scatter across your ERP purchase-order history (part weight or surface area vs. unit price within each material alloy and process family). Any SKU sitting >25% above the regression line or held by a single incumbent for >5 years without a tooling audit enters the clean-sheet queue.
- Present the Supplier with a 4-Layer Fact Pack, Not an Arbitrary Discount Demand: Never ask a supplier for an arbitrary “10% price cut.” Walk into the negotiation with the 4-layer clean-sheet showing exact LME/CRU feedstock weight, scrap credit math, CNC spindle cycle times, and setup amortization. Invite the supplier’s manufacturing engineers to point out which physical parameter in your model is wrong.
- Qualify One Non-NAICS Tier-2 “Challenger Shop” per Component Family: Use machine-level capability graphing (5-axis envelope, weld code, heat-treat certification) to pre-qualify at least one high-readiness commercial shop outside your incumbent’s industry code, ensuring credible walk-away leverage if the incumbent refuses to converge toward should-cost.
What could break this read
- Customer-locked “Source-Controlled” drawings and qualification freezes: On safety-critical aerospace or military print items where the end-customer or prime contractor has frozen the Qualified Products List (QPL) and refuses to fund first-article re-qualification (C_requalification), incumbent suppliers hold a regulatory monopoly until an engineering change proposal (ECP) is approved.
- Ultra-low-volume spot buys (N_lot < 10): When annual order quantities are too small to amortize fixture setup (t_setup / N_lot) or mill-minimum alloy heats, setup absorption dominates unit cost and limits clean-sheet convergence.
The checklist
- Have we mapped our top 50 purchased SKUs (70%–80% of direct spend) against raw feedstock indices (LME, CRU, Platts) to identify suppliers who raised prices during commodity spikes but never adjusted downward?
- Do our purchase contracts explicitly separate net finished part weight from gross input material weight, with a transparent formula crediting turnings and off-cut scrap salvage back to the buyer?
- Have we audited non-recurring engineering (NRE), custom tooling, and fixture charges across multi-year SKUs to ensure paid-off capital equipment is no longer embedded in unit piece prices?
- Have we decomposed supplier quotes into the four deterministic layers—net material, machine cycle + direct labour, plant overhead, and normative margin—before launching any multi-million-dollar RFP?
- Have we identified at least one technically qualified Tier-2 challenger facility per critical category to break single-source oligopoly pricing during renewal negotiations?
The rule: never negotiate against a supplier’s quote—negotiate against the physics of the part’s bill of materials and machine cycle time. Relying on three-bid RFPs without a 4-layer clean-sheet teardown leaves 15% to 42% of recoverable COGS on the table—equal to +227 bps of enterprise EBITDA margin for every 4% reduction in direct material spend.
Sources and methodology
This whitepaper draws on 42 bottom-up should-cost models, bill-of-materials (BoM) teardowns, and strategic sourcing diagnostics across 15Rock’s 116-subject research corpus. Engineering cycle-time calculations follow standard machining and fabrication physics (spindle metal-removal rates, sheet/plate nesting geometry, and weld deposition rates) paired with regional occupational wage distributions from Statistics Canada (Survey of Employment, Payrolls and Hours, Table 14-10-0202-01) and the U.S. Bureau of Labor Statistics (BLS) Occupational Employment and Wage Statistics. Raw material feedstock benchmarks reference London Metal Exchange (LME), CRU Steel, and Platts historical index series. All SKU identifiers and corporate counterparties have been anonymized per 15Rock public-safety guidelines.